The Insight Engine: how I turned scattered user signals into funded projects
Every month, thousands of users tell Fig exactly why they hesitate, stall, or quit — in SMS replies, support tickets, and Figgy chat. Nobody had time to read it all. So I built an AI-assisted practice that does — then used the analysis to write the pitches and get the projects funded.
The users were talking. Nobody was listening at scale.
Fig's loan application is the entire business — a regulated flow where every hesitation costs a booking. And users constantly explain their hesitations, unprompted: they reply to drop-off SMS campaigns, they write in to CX, they argue with Figgy, our support chatbot, at 2am.
But this feedback lived in three disconnected systems, in volumes no one could read end to end: ~1,000 SMS replies, ~1,500 tickets, and ~370 Figgy conversations a month. Research happened in bursts — a usability study here, a survey there — while the richest, most honest signal accumulated unread.
The gap wasn't data. It was cadence and synthesis.
Three signal streams, one monthly report
Each month I pull the raw data, run Claude-assisted thematic analysis with a consistent coding frame, and cross-reference every theme against the funnel step it comes from — so a complaint is never just a complaint, it's a complaint at Step 9 with a known drop-off rate.
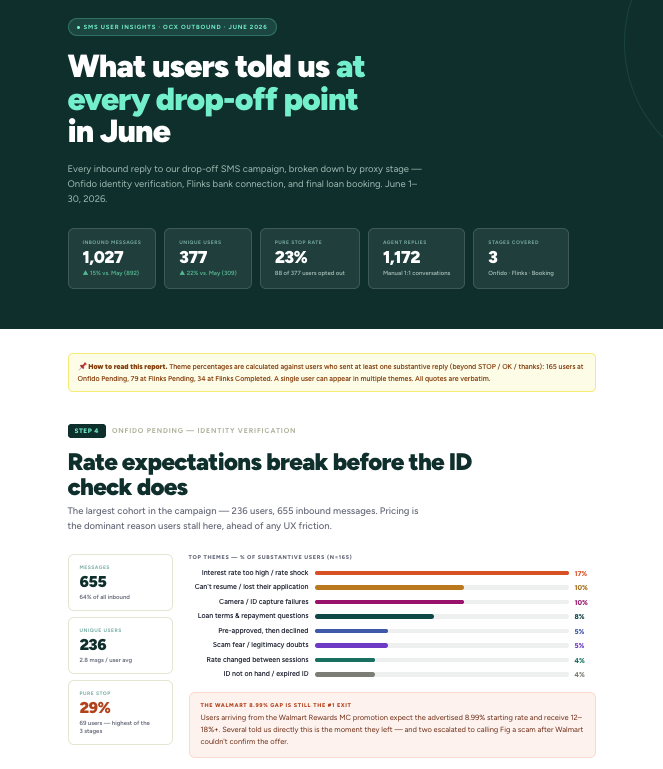
SMS insight report
Drop-off recovery campaigns invite replies, and users answer with reasons: rate shock ("you lost me at 12+"), credential distrust ("why do you need my banking password"), and bank-linking failures. Each reply is classified by theme, sentiment, and funnel step.
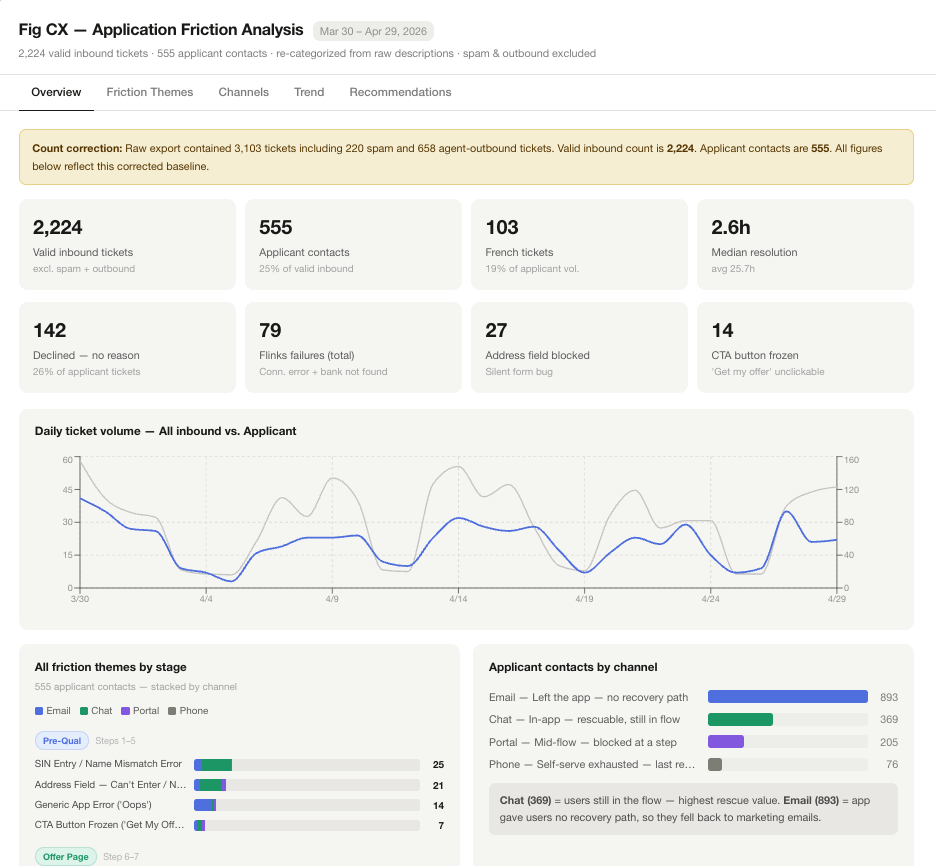
Ticket analysis
Every CX ticket is themed and mapped to the screen that generated it. Top drivers become design targets: this pipeline is how APR drift between pre-approval and customization was identified as a top ticket driver and fixed in the customize-offer redesign.
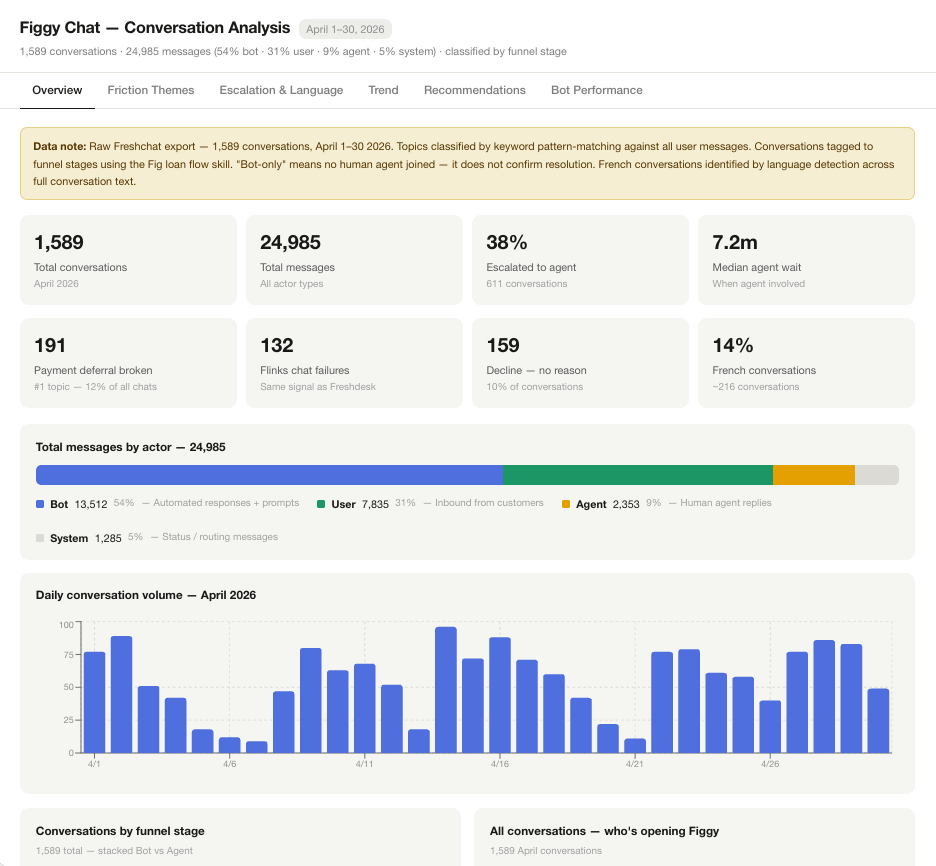
Figgy chat analysis
Chatbot transcripts are the most unfiltered stream — users ask Figgy what they won't ask a human. Bank-linking failures alone drove 23% of one month's conversations and an 87% escalation rate — the bot had no answer for a single one. Recurring questions become in-context copy on the screen where they arise.
Why AI makes this possible at all. Manually, one month of one stream is a week of coding work — nobody staffs that. With Claude doing first-pass classification against my coding frame, and me auditing samples and doing the synthesis, a full three-stream monthly report takes under 8 hours. The judgment stays human; the reading scales.
Funnel monitoring: the numbers behind the words
Alongside the qualitative streams, I run monthly step-level conversion monitoring across the entire flow — my own SQL, not a ticket to an analyst. Pre-qual completion, offer acceptance, KYC and Flinks completion, booking rate — tracked month over month, split by partner and device.
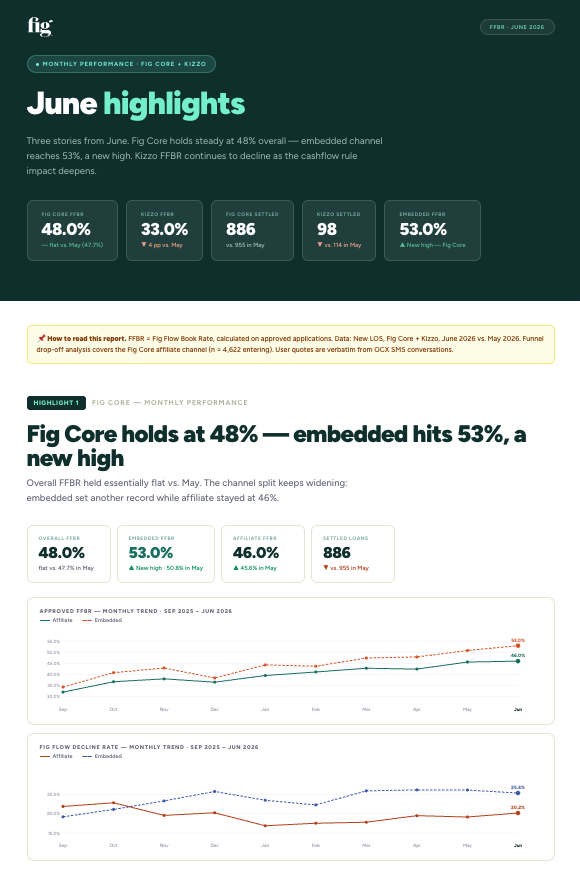
This is what turns themes into priorities. Qualitative tells me why; the funnel tells me where and how much. When 40% of SMS replies mention bank-connection fear, that's not an anecdote — that's a sized opportunity.
Insights don't ship. Pitches do.
A monthly report that gets read and forgotten is decoration. The output of this practice is pitches — sized and evidenced, entered into our Shape Up-style prioritization cycle. The pattern: a theme recurs across streams → I size it against funnel data → I write a pitch with problem, evidence, appetite, and proposed solution → it gets funded as a project for the next cycle.
The discovery — our best borrowers trust us least
Splitting verification drop-off by credit band surfaced something no usability test would find. Drop-off didn't fall as credit quality rose — it climbed.
The lowest-risk applicants — the ones with the strongest unit economics — abandoned identity and bank verification at up to twice the rate of everyone else. Prime borrowers have options, expect a VIP experience, and are the most protective of their credentials. They rarely get declined — they leave.
The SMS stream confirmed the why in their own words:
“Why do you require my banking password?”
“Can I submit a statement?”
“CIBC is unavailable.”
Three of the top five stated blockers traced to one root cause: the applicant wants to continue, verification blocks them, no fallback exists.
This one insight — found at the intersection of funnel SQL, credit data, and SMS feedback — became three funded projects.
Flinks retry — the loading screen with no exit
Four to six applicants a day got stuck retrying their bank connection — some already declined on the backend but still watching a spinner, others with a valid account stranded in a null state only CX could unstick. Both ended the same way: the applicant assumed the product was broken and texted support.
These were the highest-intent users in the funnel — bank login already handed over — lost to a state-handling gap, not a real decline. The pitch: a two-week fix that always resolves a retry into a clear terminal or actionable state. Decline exits to the decline screen; success moves the application forward; the generic retry loop becomes state-aware outcomes.
Shipped: manual CX interventions to unstick a retry dropped 80%. Applicants who used to need a human now resolve on their own.
Flinks Upload — alternative that users had been asking for
534 applicants in a single quarter passed Onfido, then abandoned at bank connection — already acquired, already verified, with ~40% of their stated reasons addressable. The pitch: a two-week spike validating bank-statement upload as a CX-assisted recovery path — 15 free trial uploads negotiated with the vendor, existing underwriting and fraud controls untouched, dual Risk + Fraud approval on every case, explicit graduation criteria before anything customer-facing.
Risk based onboarding — prevent the loss upstream
If prime borrowers behave differently, why do all borrowers get the same flow? The pitch: build the smallest reusable capability to route borrowers into onboarding experiences by risk segment, then test one lightweight trust screen before Onfido for prime users — control vs. test, feature-flagged at 20%, measured in PostHog. I designed the trust-screen variant and wrote the pitch. The sizing that got it funded: a 5pp reduction in prime Onfido drop-off — from one screen.
What being the DRI actually meant
Writing the pitch was the entry fee. Getting it funded made me the directly responsible individual for it — the person accountable for the outcome, not just the artifact. On each of them that meant owning the work from the SQL query that found the problem to the number reported back at the end of the cycle.
The analysis is what earns the DRI role. Because the insight came from my own pipeline, I was the person in the room who could answer the second and third question — which segment, how big, what did they actually say — and that is what makes a designer the obvious owner of the project rather than its illustrator.
The design-in-code pilot on this site started the same way — a pitch backed by a counted queue of blocked improvements. Different problem, same method.
Cadence beats depth
A monthly rhythm outperforms occasional deep dives. Stakeholders learn to expect the report; themes gain credibility by recurring across months; trend lines emerge that a one-off study can't see.
Users tell you everything — in the wrong places. The best research data at Fig was never in a research tool. It was in SMS replies and chatbot logs, waiting for someone to treat it as research.
Averages hide your best users. The funnel looked healthy in aggregate; segmented by credit band, it was leaking its most valuable applicants. The most consequential insight of the year came from adding one GROUP BY.
Insight is only half the job. The pipeline earns its keep the day an insight becomes a pitch, the pitch becomes a funded project, and the project moves a number.